Weston has a long, successful history of delivering innovative Information Technology and GIS solutions. More and more, our clients are generating large volumes of data through their environmental-related operations, and our teams are delivering solutions with the cutting-edge skills required to collect, manage, analyze, and visualize this data. Weston’s Enterprise Visualization and Analytics (EVA) Practice was formed to deploy our experience with environmental data to our clients’ environmental data challenges using the latest technologies. Weston’s EVA Practice combines the practical skills developed through decades of environmental field experience with software development and architecture, GIS, information management, 3-D modeling, and analytical chemistry skills. Layered on top of these skills, Weston applies a unique focus on data visualization and analytics to help transform environmental data into actionable business outcomes.
-Brad Morgan, EVA Technical Director
Weston’s in-house experts can readily work with off-the-shelf and/or proprietary leading technologies to create full-featured systems for specific projects and custom solutions for clients. We offer web-based, mobile, cloud-based solutions; and Enterprise GIS Visualization, especially those supported by the Esri ArcGIS Enterprise that include JavaScript API Web Viewers, Data Collection Apps (Collector for ArcGIS, Survey123, etc.), Esri StoryMaps, and other custom applications. We also have diverse, niche capabilities and experience using the newest tools in data management, 3D conceptual and numerical modeling, security, unmanned systems; real-time monitoring for emergency events, site assessments, remediation monitoring, stormwater management, spatial data generation, data repositories tracking data over time, and more. Visit the IM webpage for more details on our robust suite of services:
https://www.westonsolutions.com/solutions/information-management/
Did you know?
Weston has managed vast amounts of data on some of the most challenging and complex projects including the World Trade Center; Space Shuttle Columbia; Hurricanes Katrina, Rita, Ike, Sandy, Harvey, Irma, and Maria; Deepwater Horizon and Marshall, MI Oil Spills; Libby Montana Superfund Site; Northern California Wildfires; and Mt. Kilauea Volcano response?
Weston has pioneered the use of mobile field data collection tools to help ensure data are collected, processed, distributed quickly; and most importantly can be viewed, evaluated, processed, and queried on the Enterprise Architecture, meeting client-specific data quality objectives.
Our data management strategy is scalable and preserves data quality while also providing a complete framework for implementing the entire data management lifecycle, including archival information. It also includes fully integrated geospatial capability to collect, manage, publish, and report data in geospatial standard formats using the Esri ArcGIS Enterprise suite of tools.
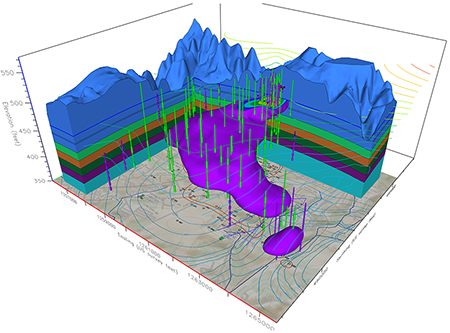
two lobes of the plume flow towards streams bounding a project site on opposite sides
Implementation of Data Solutions on Recent Projects
2019 Fire Response at the Intercontinental Terminals Company (ITC) in Deer Park, Texas
In response to fires that were ongoing at the Intercontinental Terminals Company (ITC) facility in Deer Park, Texas, Weston created a Common Operational Picture using a Geospatial Viewer depicting all the operational data dynamically that included air monitoring locations featuring on-demand charting based around various constituents of concern. In addition, for this response, Weston also created a public story map which included photos, videos, animations based on detections, water sampling locations, and more.
https://www.epa.gov/newsreleases/epa-and-tceq-announce-story-map-resource
2018 California Wildfires Response
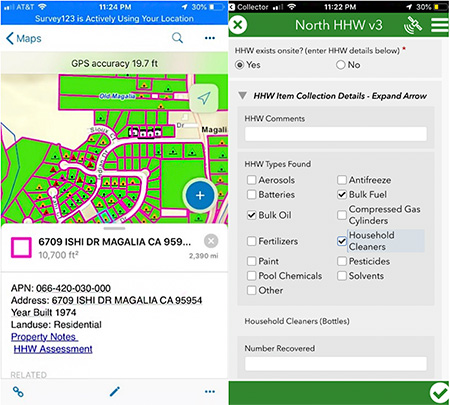
data collection architecture developed for
the 2018 CA Wildfires Response has also
been adopted by CA DTSC
In October 2018, multiple wildfires began burning in Northern, California. Weston provided technical assistance and support in Sonoma County, California in response to the wildfire that would damage an estimated 32,000 acres in Sonoma, Napa, and Lake Counties. The goal of Weston’s assignment was to reduce the potential threat to human health and the environment from potential exposure to household hazardous waste (HHW) and asbestos.
One of our key tasks was the development of field data collection forms and mapping tools; and sampling and monitoring air and bulk materials for potential contaminants (chemical, gamma radiation, and particulates). Weston’s data collection, data sharing, StoryMap development, final data archiving within a strategic data management and reporting process allowed for a seamless transition of the architecture into the state’s ArcGIS Online environment once federal involvement was completed.
Weston provided ArcGIS services for other agencies to visualize the data, an interactive web-based StoryMap for the public to view overall progress and search for their property specifically, and various data queries for reporting and data quality. Updated metrics were available throughout the day for operations and planning purposes; helped drive the incident response through nightly reporting for FEMA metrics; and automatically updated for sharing with state and county stakeholders. The custom data solution also included information regarding the cleanup efforts and resources, and an interactive map where property owners could determine when their property had been cleared of HHW debris. To date, the StoryMap has received 45,000+ views. Region 9 and Weston have been nominated for the EPA Mason Hewitt Award for Technical Excellence in GIS for work during the response to the 2018 CA Wildfires.
-Brad Morgan
2018 Mt. Kilauea Volcanic Eruption and Earthquakes, Hilo, Hawaii, A More Detailed Summary
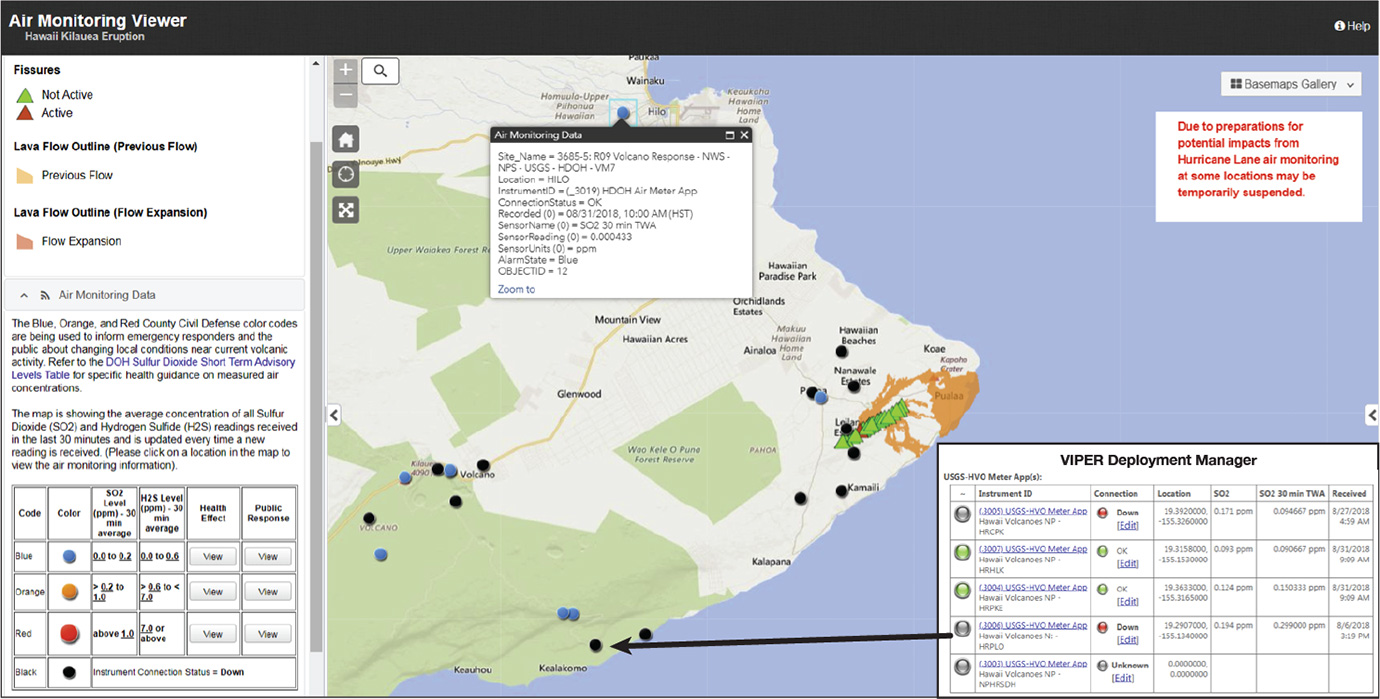
Weston was tasked with supporting EPA and other federal, state, and local stakeholders associated with Emergency Support Function 10 at impacted areas on the Island of Hawaii in the approximately 37 various response locations. Weston also deployed Esri-based Geospatial Viewers to support operations that allowed the Unified Command to see the common operational picture during tactics and planning meetings.
Weston worked closely with EPA Environmental Response Team (ERT) personnel to deploy the VIPER telemetry-enabled monitoring system in support of the Incident Command objective to monitor for air quality during the ongoing volcanic activity of the Kilauea Response. The Geospatial Operational Viewer encompassed data layers from FEMA, United States Geological Survey (USGS), and EPA, and provided a single common operational picture of all the work being completed by Unified Command. Weston, with ERT, implemented a custom Geo-JSON process to bring real-time monitoring data from multiple agencies into a single portal without the need for data replication and/or storage of this massive volume of data associated with the Kilauea Volcano events. The new, innovative approach provides the capability to map and report near real time data, reflecting the same exact data being reporting through VIPER Deployment Manager, an EPA-developed software that transmits data to the cloud-based architecture.
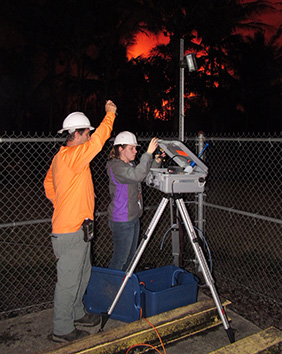
the VIPER air monitoring stations
near an active lava fountain
Monitoring was conducted in 37 unique locations continuously for over a month, with the data reported via the Viewer to provide stakeholders with air quality information and potential health impacts. To date, over 200 million records were pushed to VIPER.NET. Weston also provided support in customizing the Legend in the Viewer so that hyperlinks direct the user to Health Effects and Public Response information instead of displaying the full information under the Legend. The hyperlinks feature resulted in a more concise Legend, while still enabling the user to access the information. Additionally, Weston implemented a solution to provide the latest air monitoring reading in Hawaii Standard Time, and users could specify a refresh rate through the viewer tool to automatically refresh the readings at the station location. Weston provided custom reporting and charting popups to help deliver the overall message of air quality and the potential impact to human health.
Weston managed to create efficiencies around the process of moving extremely large quantities of data. Also, exploring the use of Geo-JSON real-time data services such as with VIPER has expanded the uses of other time critical response data to be made available by other responding agencies to enhance their own Response Common Operational Geospatial Viewers. These enhanced uses of dynamic data layers allow Weston to provide our responders, EPA, and other designated stakeholders valuable information during times of response and planning.
Stay tuned for updates on the latest innovative data solutions on federal, commercial, and state and local national projects from Weston’s EVA team.
their data…that is the future.”
-Brad Morgan
